Exploratory Data Analysis

In [2]:
from IPython.display import HTML
HTML('''<script>
code_show=true; 
function code_toggle() {
 if (code_show){
 $('div.input').hide();
 } else {
 $('div.input').show();
 }
 code_show = !code_show
} 
$( document ).ready(code_toggle);
</script>
The raw code for this IPython notebook is by default hidden for easier reading.
To toggle on/off the raw code, click <a href="javascript:code_toggle()">here</a>.''')
Out[2]:
The raw code for this IPython notebook is by default hidden for easier reading. To toggle on/off the raw code, click here.

Project Introduction

We are asked to predict bandgap and formation energy for transparent conductors. Two types of data are given: crystal structure and atomic geometry. Training set is 2400 with values of bandgap and formation energy labeled, so it is a supervised learning and regression problem. Test set is 600. Dataset is not big.

In [3]:
import pandas as pd
import numpy as np
from matplotlib import pyplot as plt
import seaborn as sns
from pymatgen.core import periodic_table
In [4]:
train = pd.read_csv('train.csv')
test = pd.read_csv('test.csv')
In [4]:
print('Train info')
train.info()
print('Test info')
test.info()
Train info
<class 'pandas.core.frame.DataFrame'>
RangeIndex: 2400 entries, 0 to 2399
Data columns (total 14 columns):
id                            2400 non-null int64
spacegroup                    2400 non-null int64
number_of_total_atoms         2400 non-null float64
percent_atom_al               2400 non-null float64
percent_atom_ga               2400 non-null float64
percent_atom_in               2400 non-null float64
lattice_vector_1_ang          2400 non-null float64
lattice_vector_2_ang          2400 non-null float64
lattice_vector_3_ang          2400 non-null float64
lattice_angle_alpha_degree    2400 non-null float64
lattice_angle_beta_degree     2400 non-null float64
lattice_angle_gamma_degree    2400 non-null float64
formation_energy_ev_natom     2400 non-null float64
bandgap_energy_ev             2400 non-null float64
dtypes: float64(12), int64(2)
memory usage: 262.6 KB
Test info
<class 'pandas.core.frame.DataFrame'>
RangeIndex: 600 entries, 0 to 599
Data columns (total 12 columns):
id                            600 non-null int64
spacegroup                    600 non-null int64
number_of_total_atoms         600 non-null float64
percent_atom_al               600 non-null float64
percent_atom_ga               600 non-null float64
percent_atom_in               600 non-null float64
lattice_vector_1_ang          600 non-null float64
lattice_vector_2_ang          600 non-null float64
lattice_vector_3_ang          600 non-null float64
lattice_angle_alpha_degree    600 non-null float64
lattice_angle_beta_degree     600 non-null float64
lattice_angle_gamma_degree    600 non-null float64
dtypes: float64(10), int64(2)
memory usage: 56.3 KB
In [57]:
print('Train describe')
train.describe()
Train describe
Out[57]:
id spacegroup number_of_total_atoms percent_atom_al percent_atom_ga percent_atom_in lattice_vector_1_ang lattice_vector_2_ang lattice_vector_3_ang lattice_angle_alpha_degree ... bandgap_energy_ev vol n_ga n_al n_in n_o mass_al mass_ga mass_in mass_o
count 2400.000000 2400.000000 2400.000000 2400.000000 2400.000000 2400.000000 2400.000000 2400.000000 2400.000000 2400.000000 ... 2400.000000 2400.000000 2400.000000 2400.000000 2400.000000 2400.000000 2400.000000 2400.000000 2400.000000 2400.000000
mean 1200.500000 141.517917 61.679167 0.385439 0.308601 0.305958 10.030005 7.086977 12.593288 90.243666 ... 2.077205 682.275370 7.588333 9.255000 7.828333 37.007500 249.714140 529.081365 898.833577 592.097796
std 692.964646 84.715548 22.598337 0.265566 0.233717 0.263198 5.645457 1.890330 5.450746 1.333655 ... 1.006845 265.429375 6.588205 7.398724 7.622701 13.559002 199.628958 459.349438 875.223314 216.935903
min 1.000000 12.000000 10.000000 0.000000 0.000000 0.000000 3.037000 2.942300 5.672500 82.744100 ... 0.000100 93.232262 0.000000 0.000000 0.000000 6.000000 0.000000 0.000000 0.000000 95.996400
25% 600.750000 33.000000 40.000000 0.166700 0.093800 0.062500 6.141100 5.833625 9.298000 89.999700 ... 1.278500 423.560725 2.000000 3.000000 1.000000 24.000000 80.944616 139.446000 114.818000 383.985600
50% 1200.500000 194.000000 80.000000 0.375000 0.281200 0.250000 9.537450 6.382950 10.125000 90.001700 ... 1.907850 790.670601 6.000000 8.000000 6.000000 48.000000 215.852309 418.338000 688.908000 767.971200
75% 1800.250000 206.000000 80.000000 0.583300 0.468800 0.468800 10.292100 9.093450 14.372050 90.006200 ... 2.761950 899.850988 11.000000 14.000000 12.000000 48.000000 377.741540 766.953000 1377.816000 767.971200
max 2400.000000 227.000000 80.000000 1.000000 1.000000 1.000000 24.913400 10.290300 25.346000 101.229800 ... 5.286100 1106.301114 32.000000 32.000000 32.000000 48.000000 863.409235 2231.136000 3674.176000 767.971200

8 rows × 23 columns

In [6]:
print('Test describe')
test.describe()
Test describe
Out[6]:
id spacegroup number_of_total_atoms percent_atom_al percent_atom_ga percent_atom_in lattice_vector_1_ang lattice_vector_2_ang lattice_vector_3_ang lattice_angle_alpha_degree lattice_angle_beta_degree lattice_angle_gamma_degree
count 600.000000 600.000000 600.000000 600.000000 600.000000 600.000000 600.000000 600.000000 600.000000 600.000000 600.000000 600.000000
mean 300.500000 139.585000 61.733333 0.371005 0.313282 0.315711 10.097994 7.081782 12.442419 90.163120 92.485953 96.331507
std 173.349358 85.636414 22.975538 0.273049 0.245566 0.275717 5.715145 1.964818 5.442646 1.021673 5.409531 24.043137
min 1.000000 12.000000 10.000000 0.000000 0.000000 0.000000 3.073200 2.960100 5.698100 83.742600 82.753100 29.724200
25% 150.750000 33.000000 40.000000 0.125000 0.093800 0.062500 6.136725 5.829025 9.309275 89.999700 90.001100 89.998975
50% 300.500000 194.000000 80.000000 0.375000 0.250000 0.281200 9.495150 6.398400 10.096500 90.001600 90.003650 90.000400
75% 450.250000 206.000000 80.000000 0.562500 0.468800 0.468800 10.362800 9.157375 14.327925 90.006200 90.014525 119.998975
max 600.000000 227.000000 80.000000 1.000000 0.968800 0.968800 24.913400 10.249500 25.305700 100.950700 105.983800 120.054000
In [7]:
print('Train head')
train.head()
Train head
Out[7]:
id spacegroup number_of_total_atoms percent_atom_al percent_atom_ga percent_atom_in lattice_vector_1_ang lattice_vector_2_ang lattice_vector_3_ang lattice_angle_alpha_degree lattice_angle_beta_degree lattice_angle_gamma_degree formation_energy_ev_natom bandgap_energy_ev
0 1 33 80.0 0.6250 0.3750 0.000 9.9523 8.5513 9.1775 90.0026 90.0023 90.0017 0.0680 3.4387
1 2 194 80.0 0.6250 0.3750 0.000 6.1840 6.1838 23.6287 90.0186 89.9980 120.0025 0.2490 2.9210
2 3 227 40.0 0.8125 0.1875 0.000 9.7510 5.6595 13.9630 90.9688 91.1228 30.5185 0.1821 2.7438
3 4 167 30.0 0.7500 0.0000 0.250 5.0036 5.0034 13.5318 89.9888 90.0119 120.0017 0.2172 3.3492
4 5 194 80.0 0.0000 0.6250 0.375 6.6614 6.6612 24.5813 89.9960 90.0006 119.9893 0.0505 1.3793

Inspect geometry file for id = 1

In [1]:
finp = open('train/1/geometry.xyz').readlines()
#finp = pd.read_csv('train/1/geometry.xyz')
#print(*finp[:])  # File truncated to save space
print('(File truncated to save space)')
(File truncated to save space)

The total number of atoms includes O, whereas the percentage of Al, Ga, In sums up to 1 and does not include O!

In [9]:
#missing data
print('Missing train values = ',train.isnull().values.sum())
print('Missing test values = ',test.isnull().values.sum())
Missing train values =  0
Missing test values =  0

Bandgap and Formation Energy

In [10]:
train.bandgap_energy_ev.hist(bins=50)
plt.xlabel('bandgap')
#train.bandgap_energy_ev.plot.density()
plt.xlim(0,6)
plt.show()
In [11]:
train.formation_energy_ev_natom.hist(bins=50)
plt.xlabel('formation energy')
#train.formation_energy_ev_natom.plot.density()
plt.xlim(0,0.7)
plt.show()

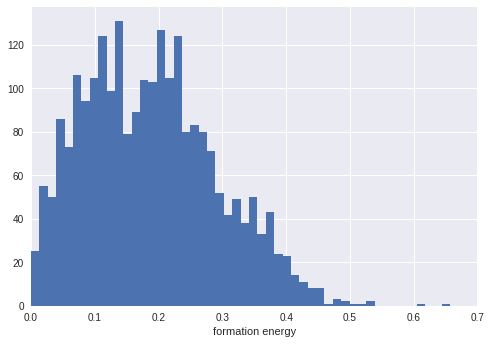
Bandgap and Formation energy both behave like normal distribution, where the range of bandgap is from 0 to ~5 eV, and formation from 0 to ~0.5 eV.

Spacegroup

In [12]:
train.spacegroup.value_counts()
Out[12]:
206    490
33     432
227    393
167    374
12     358
194    353
Name: spacegroup, dtype: int64
In [13]:
plt.bar(train.spacegroup.value_counts().index.values,train.spacegroup.value_counts(),width=10)
plt.xlabel('spacegroup')
plt.ylabel('count')
plt.xticks(train.spacegroup)
plt.show()
In [14]:
plt.scatter(train.spacegroup,train.bandgap_energy_ev)
plt.xlabel('spacegroup')
plt.ylabel('bandgap')
plt.xticks(train.spacegroup)
plt.show()

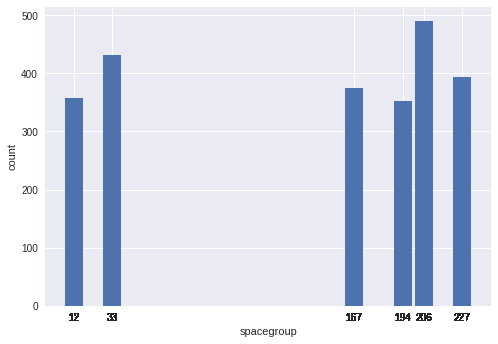
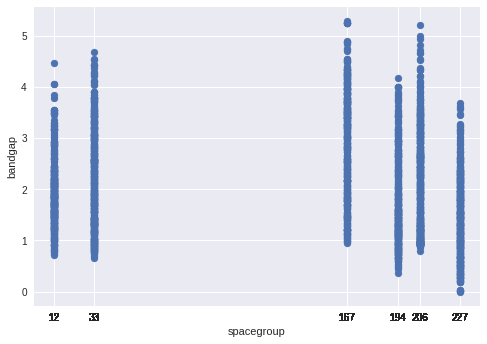
Looks like there's only 6 spacegroups and are distributed almost equally within the training set. SGs can be distinguished from each other, eg. 227 gives lower bandgap than the rest.

N total atoms

In [15]:
#train.number_of_total_atoms.hist(bins=100)
plt.bar(train.number_of_total_atoms.value_counts().index.values,train.number_of_total_atoms.value_counts(),width=10)
plt.show()

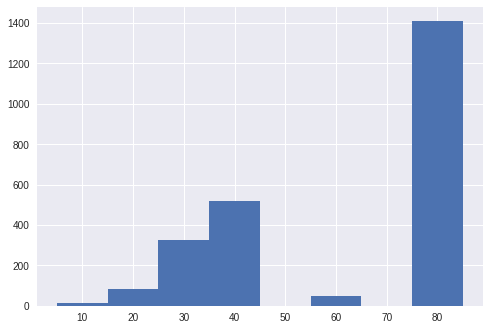
Number of total atoms take on discrete values, from 10 to 80, but not 50 and 70. Most data sets have 80 atoms.

Percentage of Al, Ga, In

In [16]:
train.percent_atom_al.plot.density()
train.percent_atom_ga.plot.density()
train.percent_atom_in.plot.density()
plt.xlim(0,1)
plt.legend()
plt.show()

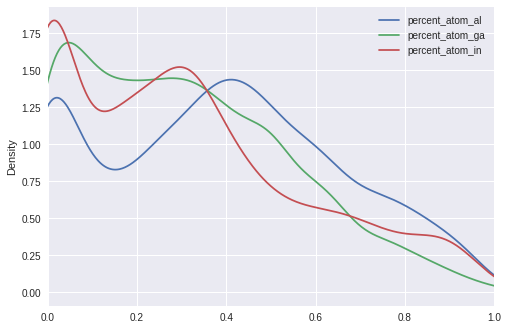
Al and Ga have two peaks, around 0 and 0.3-0.5, whereas most data has only 0.1 In.

In [17]:
print('Sum of percent of Al, Ga, In = ',train.percent_atom_al.values[0]+train.percent_atom_ga.values[0]+train.percent_atom_in.values[0])
Sum of percent of Al, Ga, In =  1.0

As pointed out earlier, total number of atom includes O, which is not included in the percent of Al, Ga, In.

Lattice vectors and angles

In [18]:
#train.lattice_vector_1_ang.hist(bins=100)
train.lattice_vector_1_ang.plot.density(color='red')
train.lattice_vector_2_ang.plot.density(color='blue')
train.lattice_vector_3_ang.plot.density(color='green')
plt.legend(['a','b','c'])
plt.xlabel('lattice vector ($\AA$)')
plt.xlim(0,30)
plt.show()

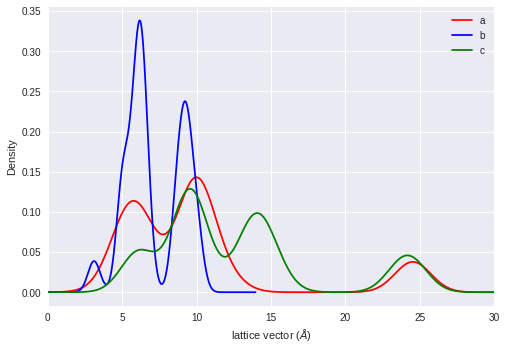
Lattice a, b, c are unique. Lattice b is less than 10 A, and most frequent values are around 5 A and 10 A. Lattice a and c can go up to 25 A.

In [20]:
#alpha
plt.subplot(121,polar=True)
plt.polar(np.deg2rad(train.lattice_angle_alpha_degree),train.bandgap_energy_ev,'b.')
plt.xlabel('bandgap vs alpha (deg)')
plt.subplot(122,polar=True)
plt.polar(np.deg2rad(train.lattice_angle_alpha_degree),train.formation_energy_ev_natom,'r.')
plt.xlabel('formation vs alpha (deg)')
plt.tight_layout()
plt.show()

#beta
plt.subplot(121,polar=True)
plt.polar(np.deg2rad(train.lattice_angle_beta_degree),train.bandgap_energy_ev,'b.')
plt.xlabel('bandgap vs beta (deg)')
plt.subplot(122,polar=True)
plt.polar(np.deg2rad(train.lattice_angle_beta_degree),train.formation_energy_ev_natom,'r.')
plt.xlabel('formation vs beta (deg)')
plt.tight_layout()
plt.show()

#gamma
plt.subplot(1,2,1,polar=True)
plt.polar(np.deg2rad(train.lattice_angle_gamma_degree),train.bandgap_energy_ev,'b.')
plt.xlabel('bandgap vs gamma (deg)')
plt.subplot(1,2,2,polar=True)
plt.polar(np.deg2rad(train.lattice_angle_gamma_degree),train.formation_energy_ev_natom,'r.')
plt.xlabel('formation vs beta (deg)')
plt.tight_layout()
plt.show()

plt.subplot(131)
train.lattice_angle_alpha_degree.plot.density()
plt.xlabel('alpha (deg)')
plt.subplot(132)
train.lattice_angle_beta_degree.plot.density()
plt.xlabel('beta (deg)')
plt.subplot(133)
train.lattice_angle_gamma_degree.plot.density()
plt.xlabel('gamma (deg)')
plt.tight_layout()
plt.show()

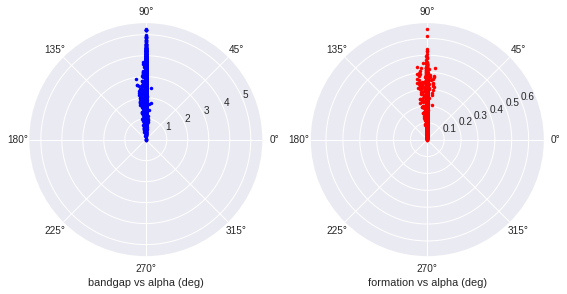
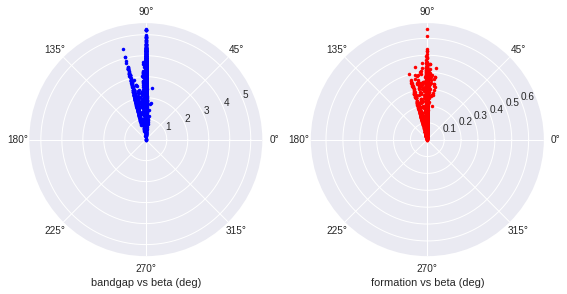
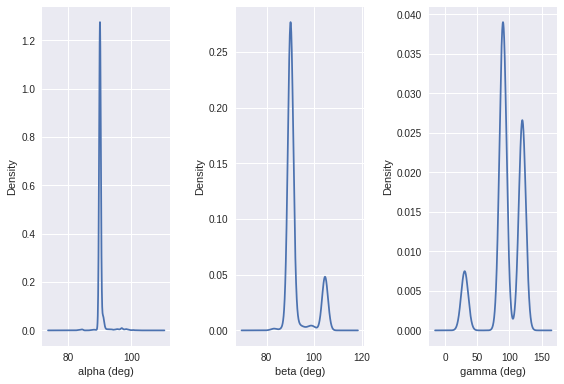
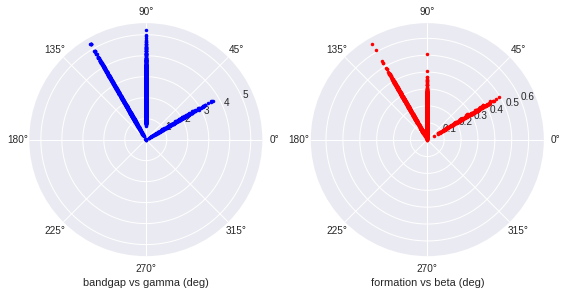
The angles seems to be discretized. Alpha is always 90 deg, beta is mostly 90 deg, sometimes 105 deg due to the restricted spacegroup. Gamma can take 30 deg, 90 deg and 120 deg.

Feature Correlation

In [21]:
train.corr()
Out[21]:
id spacegroup number_of_total_atoms percent_atom_al percent_atom_ga percent_atom_in lattice_vector_1_ang lattice_vector_2_ang lattice_vector_3_ang lattice_angle_alpha_degree lattice_angle_beta_degree lattice_angle_gamma_degree formation_energy_ev_natom bandgap_energy_ev
id 1.000000 0.042268 -0.037464 0.021495 -0.010629 -0.012250 -0.041701 -0.036477 0.041349 0.005916 -0.031354 0.008565 -0.008242 0.034987
spacegroup 0.042268 1.000000 -0.137534 0.052268 -0.053061 -0.005620 -0.570607 -0.012211 0.569755 0.183916 -0.584661 -0.007700 0.324927 -0.072725
number_of_total_atoms -0.037464 -0.137534 1.000000 -0.106022 -0.012030 0.117657 0.397917 0.651364 -0.002656 -0.172047 0.039425 0.055687 -0.048631 -0.106125
percent_atom_al 0.021495 0.052268 -0.106022 1.000000 -0.450122 -0.609300 -0.154387 -0.179604 0.032261 0.019183 -0.099428 -0.019175 0.108481 0.738622
percent_atom_ga -0.010629 -0.053061 -0.012030 -0.450122 1.000000 -0.433809 0.100244 -0.125285 -0.024424 0.000648 0.128669 0.010230 -0.374817 0.012831
percent_atom_in -0.012250 -0.005620 0.117657 -0.609300 -0.433809 1.000000 0.066761 0.292472 -0.010866 -0.019929 -0.013933 0.010259 0.223383 -0.756668
lattice_vector_1_ang -0.041701 -0.570607 0.397917 -0.154387 0.100244 0.066761 1.000000 -0.017117 -0.560387 0.002739 0.850079 -0.303708 -0.225600 -0.138901
lattice_vector_2_ang -0.036477 -0.012211 0.651364 -0.179604 -0.125285 0.292472 -0.017117 1.000000 -0.256180 -0.114209 -0.365709 -0.146586 -0.104137 -0.127461
lattice_vector_3_ang 0.041349 0.569755 -0.002656 0.032261 -0.024424 -0.010866 -0.560387 -0.256180 1.000000 0.071834 -0.471228 0.328274 0.454679 -0.156865
lattice_angle_alpha_degree 0.005916 0.183916 -0.172047 0.019183 0.000648 -0.019929 0.002739 -0.114209 0.071834 1.000000 0.189144 -0.446694 0.099277 -0.072313
lattice_angle_beta_degree -0.031354 -0.584661 0.039425 -0.099428 0.128669 -0.013933 0.850079 -0.365709 -0.471228 0.189144 1.000000 -0.195319 -0.213651 -0.077048
lattice_angle_gamma_degree 0.008565 -0.007700 0.055687 -0.019175 0.010230 0.010259 -0.303708 -0.146586 0.328274 -0.446694 -0.195319 1.000000 -0.035148 0.133285
formation_energy_ev_natom -0.008242 0.324927 -0.048631 0.108481 -0.374817 0.223383 -0.225600 -0.104137 0.454679 0.099277 -0.213651 -0.035148 1.000000 -0.454246
bandgap_energy_ev 0.034987 -0.072725 -0.106125 0.738622 0.012831 -0.756668 -0.138901 -0.127461 -0.156865 -0.072313 -0.077048 0.133285 -0.454246 1.000000

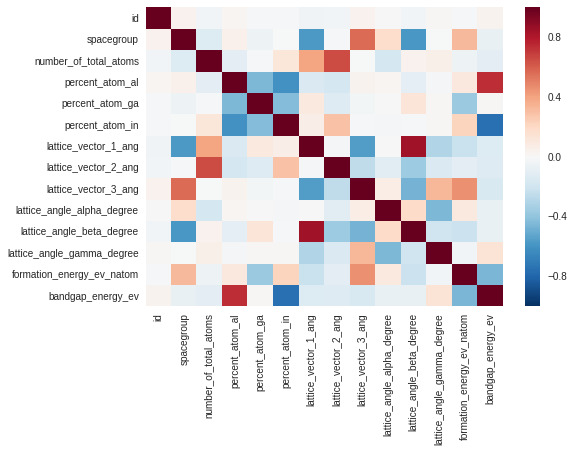
Let's visualize in a heat map.

In [22]:
#plt.imshow(train.corr(),cmap='hot')
#plt.matshow(train.corr(),cmap='hot')
#plt.colorbar()
sns.heatmap(train.corr())
plt.show()

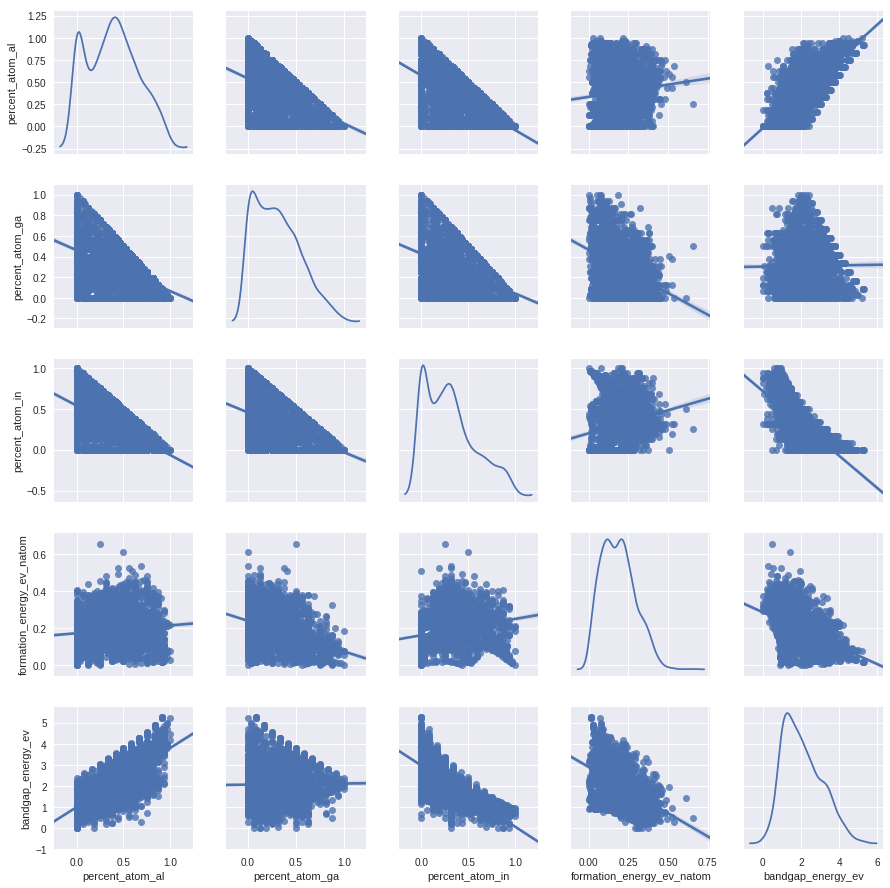
Bandgap has strong positive correlation with percent of Al, strong negative correlation with percent of In, and no correlation with percent of Ga. Formation energy is weakly (~0.4) correlated with lattice c and percent of Ga. Bandgap and formation energy are also somewhat correlated with each other.

In [23]:
sns.pairplot(train,vars=['percent_atom_al','percent_atom_ga','percent_atom_in','formation_energy_ev_natom','bandgap_energy_ev'],kind='reg',diag_kind='kde')
plt.show()

The scatter plots agree with the correlation strength.

In [24]:
sns.pairplot(train,vars=['spacegroup','lattice_vector_3_ang','percent_atom_ga','formation_energy_ev_natom'],kind='reg',diag_kind='kde')
plt.show()

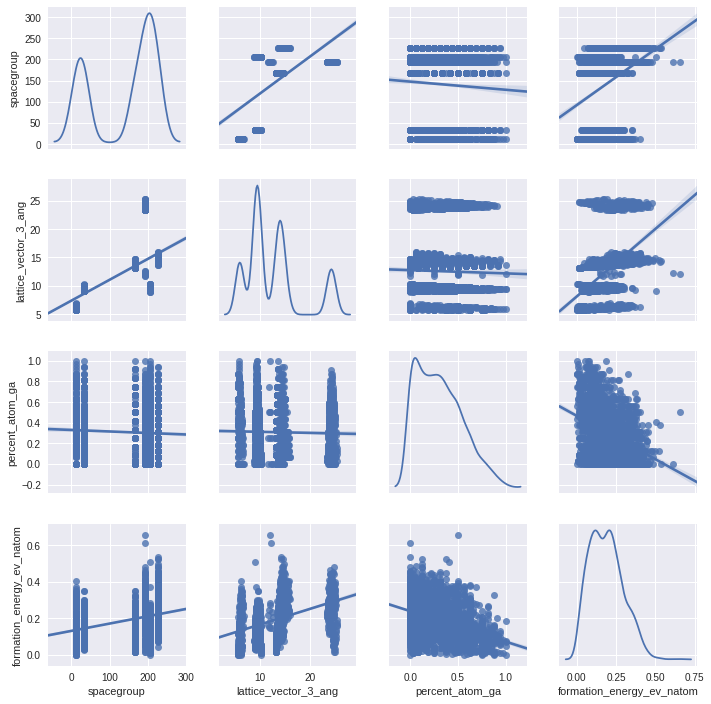
Eventhough the spacegroup, lattice c and percent of Ga shows some correlation with the formation energy, the regression doesn't fit too well.

New feature generation: Volume

In [6]:
def get_vol(a,b,c,alpha,beta,gamma):
    
    vol = a*b*c*np.sqrt(1+2*np.cos(np.deg2rad(alpha))*np.cos(np.deg2rad(beta))*np.cos(np.deg2rad(gamma))-np.cos(np.deg2rad(alpha))**2-np.cos(np.deg2rad(beta))**2-np.cos(np.deg2rad(gamma))**2)
    
    return vol
In [7]:
train['vol'] = get_vol(train.lattice_vector_1_ang,train.lattice_vector_2_ang,train.lattice_vector_3_ang,train.lattice_angle_alpha_degree,train.lattice_angle_beta_degree,train.lattice_angle_gamma_degree)
test['vol'] = get_vol(test.lattice_vector_1_ang,test.lattice_vector_2_ang,test.lattice_vector_3_ang,test.lattice_angle_alpha_degree,test.lattice_angle_beta_degree,test.lattice_angle_gamma_degree)
In [27]:
sns.pairplot(train,vars=['vol','bandgap_energy_ev','formation_energy_ev_natom'],kind='reg',diag_kind='kde')
plt.show()

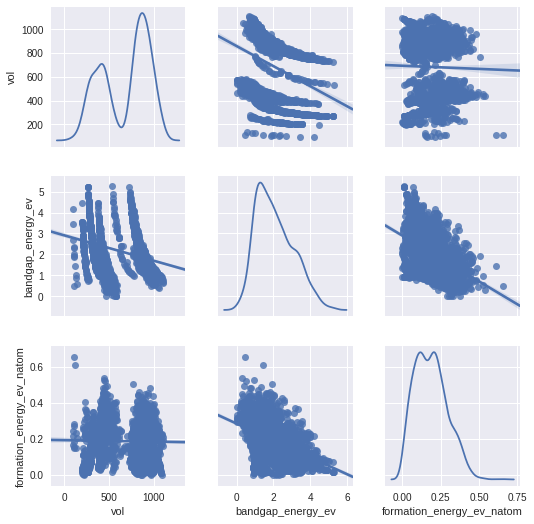
Vol, a new feature generated from lattice, show some correlation with bandgap and formation energy.
New feature generation: Total Mass of Al, Ga, In

In [8]:
def get_n_atom(df,df_name):
    
    N_Ga = []
    N_Al = []
    N_In = []
    N_O = []
    for i in df.id:
        n_Ga = 0
        n_Al = 0
        n_In = 0
        n_O = 0
        with open(str(df_name) + '/' + str(i) + '/geometry.xyz','r') as finp: 
            for line in finp:
                if line.split()[0] == 'atom':
                    if line.split()[4] == 'Ga':
                        n_Ga += 1
                    elif line.split()[4] == 'Al':
                        n_Al += 1
                    elif line.split()[4] == 'In':
                        n_In += 1
                    elif line.split()[4] == 'O':
                        n_O += 1
        N_Ga.append(n_Ga)
        N_Al.append(n_Al)
        N_In.append(n_In)
        N_O.append(n_O)
    df['n_ga'] = pd.DataFrame(N_Ga)
    df['n_al'] = pd.DataFrame(N_Al)
    df['n_in'] = pd.DataFrame(N_In)
    df['n_o'] = pd.DataFrame(N_O)
    
    return df['n_al'], df['n_ga'], df['n_in'], df['n_o']
In [9]:
def get_mass(df):
    
    mass_ga = periodic_table.Element['Ga'].atomic_mass
    mass_al = periodic_table.Element['Al'].atomic_mass
    mass_in = periodic_table.Element['In'].atomic_mass
    mass_o = periodic_table.Element['O'].atomic_mass
    tot_mass_ga = df['n_ga']*mass_ga
    tot_mass_al = df['n_al']*mass_al
    tot_mass_in = df['n_in']*mass_in
    tot_mass_o = df['n_o']*mass_o
    
    return tot_mass_al, tot_mass_ga, tot_mass_in, tot_mass_o
In [10]:
train.n_al, train.n_ga, train.n_in, train.n_o = get_n_atom(train,'train')
test.n_al, test.n_ga, test.n_in, test.n_o = get_n_atom(test,'test')
In [11]:
train['mass_al'], train['mass_ga'], train['mass_in'], train['mass_o'] = get_mass(train)
test['mass_al'], test['mass_ga'], test['mass_in'], test['mass_o'] = get_mass(test)
In [32]:
sns.pairplot(train,vars=['n_al','n_ga','n_in','n_o','mass_al','mass_ga','mass_in','mass_o','formation_energy_ev_natom','bandgap_energy_ev'],kind='reg',diag_kind='kde')
plt.show()

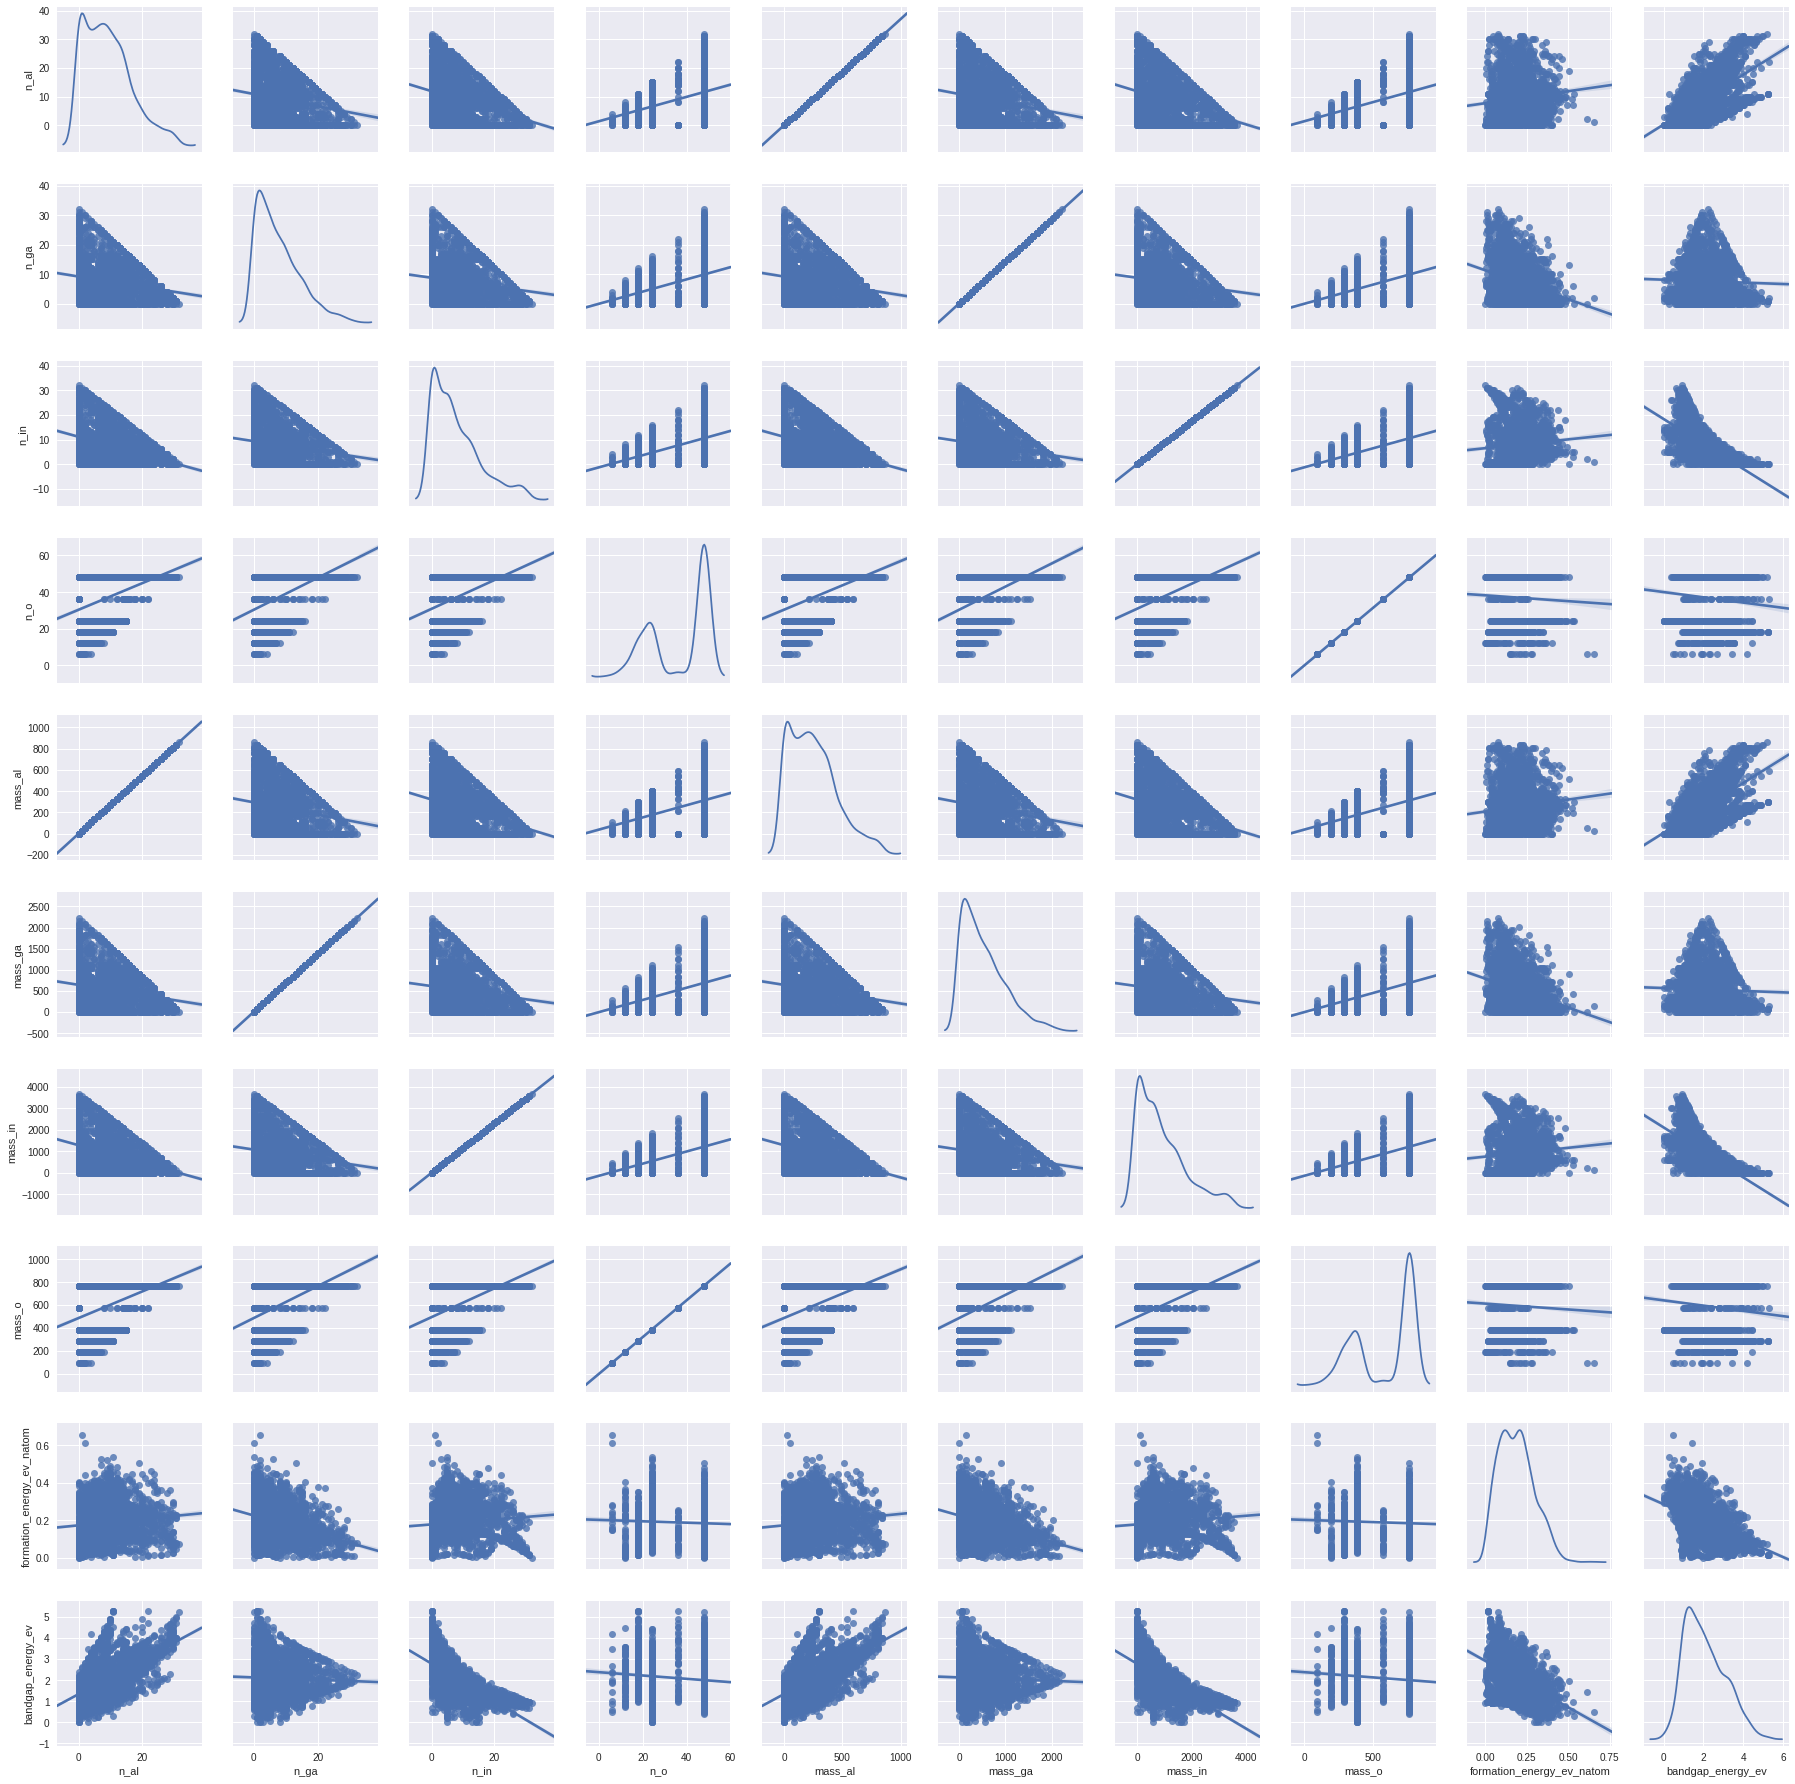
Al, Ga and In (except O) show good correlation with the bandgap and formation energy.